Log InSign Up
  • Primary
  • Secondary
  • Cryptolending
  • Token
  • My investments
  • More
    Leagues
    Transactions
    Referral program
    Help & Feedback
    Twitter
    Telegram
    LinkedIn
  • Primary
  • Secondary
  • Cryptolending
  • Token
  • My investments
  • More
Log InSign Up
PrimarySecondaryCryptolendingInvestments
PrimarySecondaryCryptolendingTokenMy investments
LeaguesTransactionsReferral programHelp & Feedback
TwitterTelegramLinkedIn
Trustpilot
  • Terms and Conditions
  • Privacy Policy
  • Help & Feedback
  • WEB2 Platform
🛠 ManufacturingID: 777

VALIYAN

600USDC
2% of 30,000 USDC
Risk scoreAA
Annual interest17.90 %
Term10 months
Expires
Sign up to Invest
Overview
Risk scoring
Financials
Collateral
Borrower
More than 25 years of profitable operations

VALIYAN Ltd. is a Bulgarian premium furniture manufacturer and turnkey FF&E contractor for hotel operators. It is raising €2.3M to move its 10,000 m² Sofia plant to Industry 4.0 and bring four premium finishing technologies in-house.

600USDC
2% of 30,000 USDC
Risk score: AA10 months17.90 %
VALIYAN

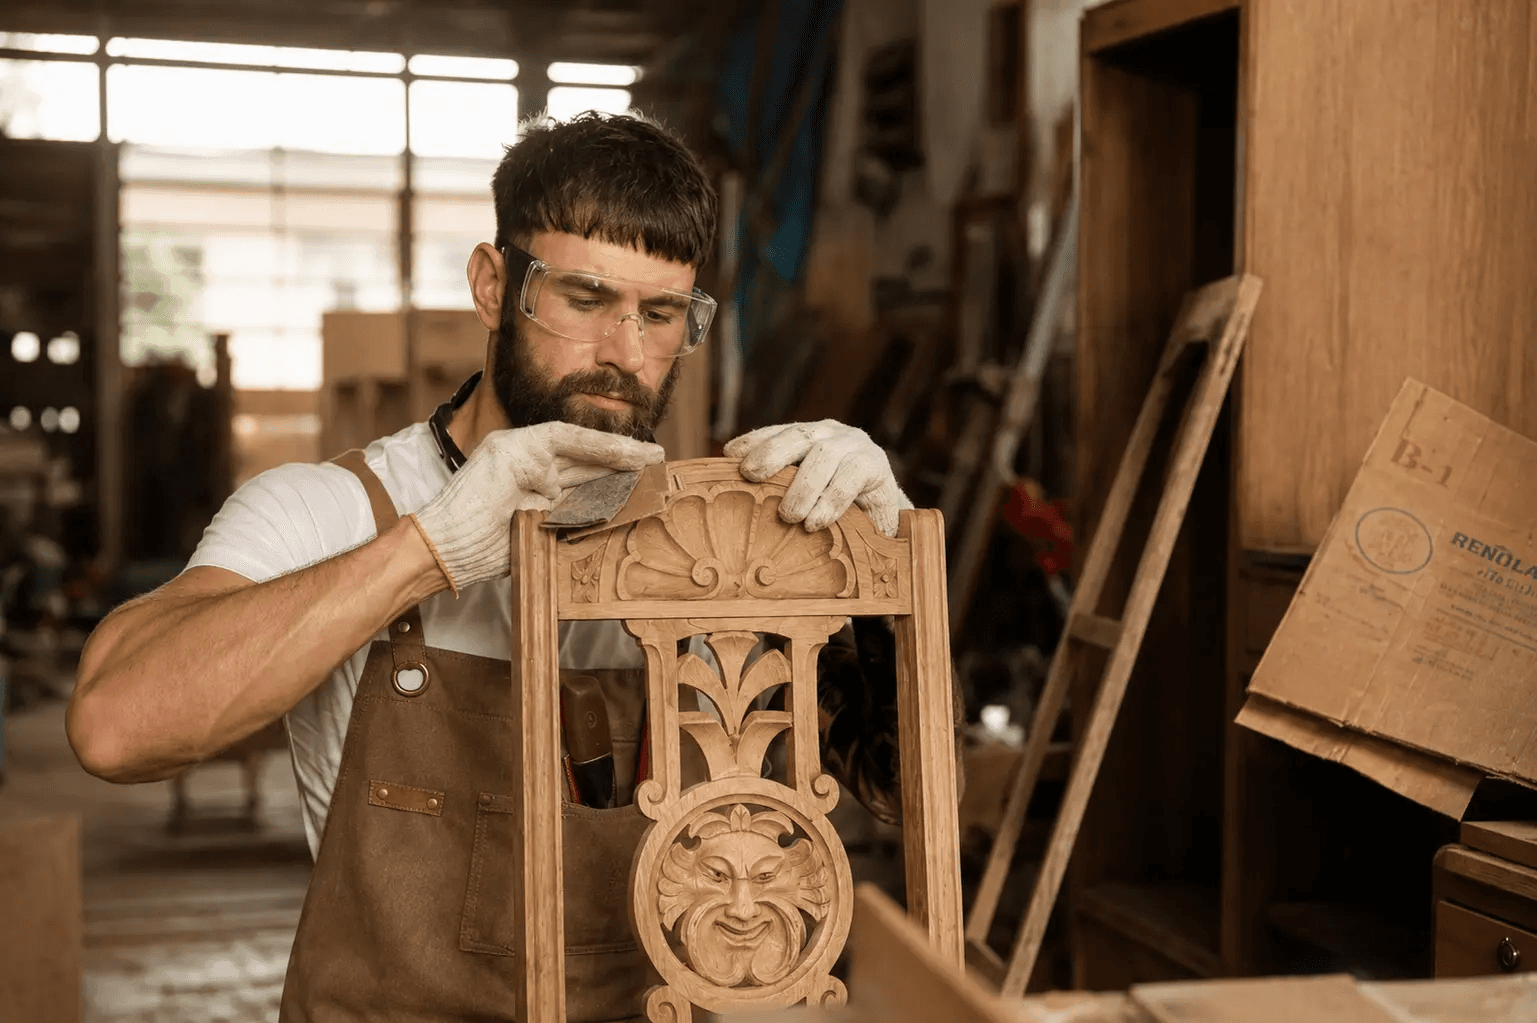
VALIYAN LTD is a Bulgarian manufacturer of premium-segment furniture and a turnkey FF&E (furniture, fixtures and equipment) contractor for international hotel operators, wellness resort chains, corporate and retail clients and owners of premium residential property. Founded in Sofia in November 1999 by two partners who began in a small rented workshop, the company has grown over more than a quarter of a century into an international supplier executing the full production cycle — concept development and technical documentation, cutting, facade production, finishing lacquer, upholstery and assembly, international logistics and installation on site — at its own 10,000 m² production complex in Sofia. It has completed several hundred projects across its home market and thirteen European export markets, runs at least five multi-site rollout programmes each year and reports a consistently high share of repeat clients. The proposed financing funds the next stage of a development sequence the company has completed repeatedly through successive investment cycles: the transition of the plant to an Industry 4.0 architecture, together with premium-segment finishing technologies.

The workforce exceeds 120, the majority of it in production. The commercial proposition is accountability: the client contracts one counterparty for an engineered, manufactured, delivered and installed interior package, and the company answers for the whole of it against the specification — where otherwise the client would coordinate joinery, upholstery, lighting, textiles, metalwork, stone and installation as separate contracts and carry the interfaces between them. The company holds ISO 9001, ISO 14001, ISO 45001, FSC and EMAS certification — the supplier-qualification threshold of international hotel operators — and has received institutional recognition as one of the greenest industrial companies in the country for the energy-saving and waste-processing systems of its plant.

Corporate identifiers: VALIYAN LTD (ВАЛИЯН ООД), a Bulgarian limited liability company; EIK 130122979; VAT BG130122979; registered 02.11.1999; registered office 7 Obelsko Shose Street, Lyulin district, Sofia 1360, Bulgaria; share capital EUR 2,556, fully paid, held equally by the two founders. The profile draws on the company’s statutory accounts, the January–August 2026 management report, the business plan and the corporate documentation reviewed for the investment memorandum.

Ownership, Leadership and Governance

The company is owned and managed by its founders, Valentin Nikolaev Georgiev and Yankul Georgiev Yankov, each holding 50% of the capital and a director’s mandate with the right of sole representation — the same two-director model that has run the company since 1999 without documented disruption. Responsibilities divide by domain: one director leads design and the client-facing side of the business, the other production, with commercial and financial matters shared. Day-to-day operational management and the company’s public representation have passed to a second-generation team of commercial and technical leaders, while the founders retain ownership control and strategic direction — a transition the company reports as completed without disruption. The concentration of strategy and principal client relationships in the two owner-managers gives the company speed of decision at the cost of key-person dependency, a trade-off structural to a family-owned manufacturer at this scale and mitigated by the functional heads and middle-management layer beneath the directors.

Business Model and Revenue Mechanics

VALIYAN manufactures to order — nothing is made for stock — and sells one vertically integrated production core through five reinforcing commercial formats:

  • Turnkey FF&E project contracts — the principal revenue stream: complete interior packages engineered, produced, delivered and installed under one contract for hotel, wellness, corporate and specialised properties, including multi-site rollout programmes in which one approved specification is replicated across a series of properties.
  • Bespoke residential interiors — complete furnishing of luxury residences, channelled through leading architectural practices and the company’s Sofia showroom, at margins above the company average.
  • Own-brand catalogue collections — a standardised line of upholstered furniture made to order in configurable fabric, leather and finish options, with a short order cycle and no repeated engineering.
  • Designer collaborations — joint lines with invited international designers and architects, including award-recognised pieces shown at leading industry exhibitions; the format earns reputation and the designer network that channels project orders.
  • OEM production — custom furniture ordered by international design studios under their own name for their end clients, a growing format whose economics rest on repeat orders without new client acquisition.

Pricing follows project economics rather than a price list: each proposal builds up the full cost of the package — materials, own production, subcontracted works, logistics and installation — and adds margin at three points: on in-house manufacturing, on the coordination of subcontracted components, and on the management of the project as a whole. The payment structure de-risks the cycle: an advance of at least 30% at signature, interim tranches tied to production and installation milestones, and final settlement on acceptance. Material prices are fixed with suppliers at quotation, so margin is not exposed to price movements between proposal and production, and every contract, domestic and export, is denominated and settled in euro. Repeat revenue is built on relationships: hotel operators return on the 7–10-year renewal cycle of their room stock, one delivered brand standard converts into rollout series, corporate clients return on expansion and refurbishment, and in residential work the architectural practice — not the end client — is the recurring counterparty.

Product Portfolio and Geographic Footprint

The portfolio is organised in four product groups, combined into one turnkey package in hospitality, wellness, corporate and retail projects and in the configuration each property requires in residential work:

  • Casegoods and built-in furniture — the production core: wardrobes, cabinets, tables, reception desks, minibar units and headboards, kitchens, bathroom modules, wall panelling, door systems and built-in integrations, manufactured across a palette from FSC-certified solid wood and veneer to solid-surface composites, brass, stainless steel, glass, stone and marble.
  • Upholstered furniture — project orders to individual specification and the own-brand catalogue line of sofas and armchairs, produced on the complex’s own upholstery line.
  • FF&E components and integration — lighting, curtains and textiles, mirrors, decorative elements and special finishes, performed partly in-house and partly through specialised subcontractors within the one client contract — the layer that turns a furniture delivery into a complete interior.
  • Designer furniture and collaborations — an award-recognised line created with international design studios; the company has debuted at the leading world furniture exhibition as part of the national stand.

Bulgaria is the home and largest market, where the company is present across all four client segments. Completed projects span thirteen export markets — Austria, Germany, Switzerland, France, the United Kingdom, Italy, the Netherlands, Denmark, Belgium, Hungary, Romania, Croatia and Norway — with the DACH region the largest export cluster. Deliveries run by road within the single market without customs procedures; orders outside the EU arrive through the OEM design-studio channel. Spain, Portugal, Greece, Poland, the Czech Republic, Slovenia and Scandinavia are identified for expansion, to be entered through the operator and studio relationships established on current markets.

Key Clients, Target Audience and Go-to-Market

The company sells B2B into the project supply chains of five buyer groups: international hotel operators, contracting both room-stock renewal programmes and new openings and rollouts; wellness and spa resort chains, served with series of properties to a common specification; owners of premium residential property, engaging through leading architectural practices; corporate and retail clients, commissioning headquarters, offices, premium retail spaces and specialised educational facilities; and international design studios in the OEM format. The buyer structure shapes the selling: in hospitality the brand’s design or technical department specifies while the developer, owner or management company pays, and one delivered brand standard qualifies the company across that brand’s other properties and developers; in corporate and residential work the architectural practice is the gatekeeper, and one practice tends to bring a sequence of projects for different end clients. In this summary clients and counterparties are described by role rather than named, each being identified in the investment memorandum. The documented growth pipeline stands at EUR 16,100,000 across ten engagements with nine distinct counterparties — EUR 2,870,000 in execution, EUR 6,790,000 in documentation with commercial terms agreed and EUR 6,440,000 under letters of intent, ~47.9% of it with repeat clients — and is set out in the Growth Plan section of this summary.

Production Platform and Organisational Structure

The execution model keeps the critical value chain in-house: engineering and brand-standards knowledge, CNC machining across fifteen centres, facade production, finishing lacquer on a line recovering up to 97% of process heat, the upholstery cycle, project management and the company’s own installation crews. Auxiliary and narrow-specialism works — lighting, textiles, stone and metal specialities, international transport, customs brokerage — are contracted from an established pool of profile partners integrated into the company’s project structure. The plant runs on photovoltaic generation with battery storage, geothermal cooling, rainwater recovery and central extraction, with an ERP system over the production flow. The proposed investment programme addresses the platform’s binding constraints directly: automated material flow, a second finishing line and real-time production management multiply the number of programmes the plant can run in parallel, and four premium-finish technologies bring subcontracted, higher-value specification positions in-house.

Summary

VALIYAN is a mature, full-cycle industrial operator: more than twenty-five years of continuous operating history, an owned and certified 10,000 m² production complex, several hundred completed projects across its home market and thirteen export markets, a delivery record under the brand standards of international hotel operators, and a business model that stacks manufacturing, coordination and integration margin inside one contract. Its constraints are those structural to a family-owned manufacturer at this scale, and each carries a mitigant: strategy and key client relationships concentrate in the two founder-owners, balanced by the functional split between them, the management layers below and the completed generational transition; all production depends on the single, insured Sofia site; the order book is rebuilt through relationship cycles rather than framework agreements, spread across four client segments and five commercial formats; and hospitality, the largest segment, moves with the hotel investment cycle, softened but not offset by the corporate, residential and OEM flows. The company enters the proposed financing with a history of profitable operations and serviced credit facilities, and with a facility directed at the next stage of an investment sequence it has completed repeatedly in the past.

Loan Collateral


To secure the proposed EUR 2,300,000 facility, VALIYAN offers a consolidated collateral package built on two hard-asset layers: the equipment acquired through the loan-financed investment programme, offered as first-priority pledged collateral, and the company’s existing operational asset base — the land, buildings, machinery and technical installations of the Sofia production complex. Collateral is presented at base value (invoice purchase cost for the new equipment, current replacement value for the existing assets) and at a conservative liquidation value on an orderly forced-sale basis, with defined recoveries of 40–75% by asset category. Of the facility, EUR 1,900,400 (82.6%) is deployed into tangible, serial-numbered equipment that forms the pledgeable loan-financed base; the remaining EUR 399,600 (17.4%), covering software, integration, delivery and commissioning, is consumed into licences and services, produces no separable recoverable asset and is excluded from the collateral base. No encumbrances over the existing asset base have been reported by the company; the ranking and registration of the security will be established in the facility documentation.

Hard collateral summary (EUR)

Collateral source

Base value

Liquidation value

Coverage of principal (liquidation)

Loan-financed equipment (first-priority pledge)

1,900,400

1,420,675

61.8%

Existing operational assets (land, buildings, machinery, installations)

28,399,520

17,951,526

7.8×

TOTAL (hard collateral)

30,299,920

19,372,201

8.4×

The scale of the existing base is the defining feature of the package. The Sofia complex enters the collateral at a current replacement value of EUR 28,399,520: a serviced industrial land plot of approximately 18,000 m² (EUR 2,500,000, 75% recovery), the purpose-built, insured 10,000 m² production facility with its administrative part (EUR 6,630,000, 70%), eleven groups of production machinery totalling EUR 12,425,730 (70%) — woodworking machinery of leading European manufacturers with an established pan-European secondary market, led by the CNC machining and nesting park of EUR 4,445,000 — and the plant’s technical installations of EUR 6,843,790, carried at a conservative 40% because their realisable value is principally as part of the property complex. The loan-financed layer adds the nine equipment sections of the Growth Plan: serial-numbered, invoice-backed, insurable production assets that remain at the company’s premises throughout the loan term, carried at a 75% recovery against established secondary markets for woodworking, finishing and robotic machinery, with the MES shop-floor hardware at the standard 50% IT-hardware discount.

Coverage of principal and of the total repayment obligation

Coverage metric

At base value

At liquidation value

Hard collateral vs EUR 2,300,000 principal

13.2×

8.4×

Hard collateral vs EUR 2,711,125 total repayment (principal + interest)

11.2×

7.1×

On a conservative liquidation basis the package provides multiple coverage of the facility from hard assets alone: the pledged new equipment covers 61.8% of principal by itself, the existing operational base covers principal 7.8 times on its own, and the combined hard collateral covers principal 8.4× and the full repayment obligation, principal and interest, 7.1× — no supplementary layers of inventory or receivables are required to reach full coverage. The package is secured by production-critical assets, consistent with the purpose of the loan and straightforward to evidence, insure and monitor, and it strengthens as the programme is executed: each drawdown converts directly into a pledged asset installed at the complex and insured in favour of the lender. The primary repayment source remains the company’s operating cash flow, with the collateral providing downside protection at a multiple of the exposure.

VALIYAN LTD was foundedNov 2, 1999
Start of active work/productionJan 1, 2000
Min target15,000 USDC
Investors2
Interest paymentsmonthly
Principal repaymentsbullet
Total payments10 months

Details

Financial Performance

On the reported figures, VALIYAN shows a steadily scaling, consistently profitable operation: production output rose from EUR 3,886,328 (2023) to EUR 5,010,148 (2024), held that level at EUR 5,004,014 (2025), and steps up to EUR 6,123,651 (2026F) and EUR 6,593,590 (2027F) as the capacity added under the proposed facility comes on line. Every period in the dataset closed with a net profit — EUR 643,205 to EUR 840,752 in the historical years and EUR 1,268,210 in January–August 2026 alone — on gross margins of 29.9–32.3% in 2023–2025 and an elevated 2026 profile explained by delivery timing below.

Output growth by year is: +28.9% (2024), (0.1%) (2025), +22.4% (2026F), +7.7% (2027F).

One reading note applies to all tables in this section. The company manufactures to order and reports on production output — revenue plus the change in work in progress — because a project still in production at a year-end recognises its revenue only on delivery and acceptance. Output measures what was manufactured in the period regardless of delivery timing, and every margin below is calculated on it. This is what reconciles the swing in reported revenue between 2025 (EUR 2,950,666, with EUR 2,053,348 added to work in progress) and 2026 (EUR 7,732,862, when those projects were delivered and invoiced): activity across the two years was stable and rising, and only the delivery schedule moved between them.

Income statement highlights in EUR (2023–2025)

Metric

2023

2024

2025

Revenue

5,058,211

5,264,773

2,950,666

— of which product revenue

4,988,164

5,109,340

2,846,362

— of which services revenue

70,047

155,433

104,304

Change in work in progress

(1,171,883)

(254,625)

2,053,348

Production output

3,886,328

5,010,148

5,004,014

Cost of sales

(2,663,590)

(3,391,375)

(3,506,180)

Gross profit

1,222,738

1,618,773

1,497,834

Operating expenses

(413,876)

(338,499)

(335,668)

EBITDA

808,862

1,280,274

1,162,166

Depreciation and amortisation

(395,229)

(433,576)

(503,111)

EBIT

413,633

846,698

659,055

Financial income

664,679

191,222

175,884

Financial expenses

(214,743)

(213,209)

(191,734)

— of which interest on existing facilities

(213,720)

(210,141)

(189,689)

— of which other financial expense

(1,023)

(3,068)

(2,045)

Net financial result

449,936

(21,987)

(15,850)

Profit before tax

863,569

824,711

643,205

Income tax

(22,817)

(23,209)

—

Net profit

840,752

801,502

643,205

Current-year actuals in EUR (January–August 2026)

Metric

2026 (Jan–Aug)

Revenue

5,514,259

— of which product revenue

5,348,831

— of which services revenue

165,428

Change in work in progress

(1,284,987)

Production output

4,229,272

Cost of sales

(2,336,943)

Gross profit

1,892,329

Operating expenses

(225,957)

EBITDA

1,666,372

Depreciation and amortisation

(371,130)

EBIT

1,295,242

Financial income

126,081

Financial expenses

(120,137)

Net financial result

5,944

Profit before tax

1,301,186

Income tax

(32,976)

Net profit

1,268,210

The eight months already reported for 2026 exceed the full-year EBIT and net profit of every historical year, as the carry-over projects manufactured in 2025 were delivered and invoiced and EUR 1,284,987 was released from work in progress.

Income statement forecast in EUR (2026F–2027F)

Metric

2026F (Sep–Dec)

2026F (Full Year)

2027F

Revenue

2,218,603

7,732,862

6,740,748

— of which product revenue

2,152,045

7,500,876

6,538,526

— of which services revenue

66,558

231,986

202,222

Change in work in progress

(324,224)

(1,609,211)

(147,158)

Production output

1,894,379

6,123,651

6,593,590

Cost of sales

(1,183,196)

(3,520,139)

(4,249,662)

Gross profit

711,183

2,603,512

2,343,928

Operating expenses

(112,978)

(338,935)

(421,730)

EBITDA

598,205

2,264,577

1,922,198

Depreciation and amortisation

(185,565)

(556,695)

(613,776)

EBIT

412,640

1,707,882

1,308,422

Financial income

63,040

189,121

189,121

Financial expenses

(169,701)

(289,838)

(472,687)

— of which interest on existing facilities

(60,068)

(180,205)

(171,195)

— of which interest on the proposed facility

(109,633)

(109,633)

(301,492)

Net financial result

(106,661)

(100,717)

(283,566)

Profit before tax

305,979

1,607,165

1,024,856

Income tax

(7,755)

(40,731)

—

Net profit

298,224

1,566,434

1,024,856

Growth and margin indicators

Metric

2023

2024

2025

2026 Jan–Aug

2026F Sep–Dec

2026F FY

2027F

Output growth

—

28.9%

(0.1%)

—

—

22.4%

7.7%

Gross profit margin

31.5%

32.3%

29.9%

44.7%

37.5%

42.5%

35.5%

OPEX / Output

10.6%

6.8%

6.7%

5.3%

6.0%

5.5%

6.4%

EBITDA margin

20.8%

25.6%

23.2%

39.4%

31.6%

37.0%

29.2%

EBIT margin

10.6%

16.9%

13.2%

30.6%

21.8%

27.9%

19.8%

Net margin

21.6%

16.0%

12.9%

30.0%

15.7%

25.6%

15.5%

Output, revenue and gross margin trends

The trajectory is one of controlled scale-up rather than volatility: a 28.9% step in 2024, a deliberately held level in 2025 while a large block of orders remained in production for 2026 delivery, and forecast growth of 22.4% and 7.7% as the expanded capacity comes on line. Gross margin tells the same story once 2025 and 2026 are read as the single production-and-delivery cycle they form: part of the margin manufactured in 2025 was recognised on delivery in 2026, so the blended margin across the two years — gross profit of EUR 4,101,346 on output of EUR 11,127,665, or 36.9% — is the representative figure. The elevated single-period readings of 2026 (44.7% in January–August, 42.5% for the full year) are the counterpart of the lower revenue reported in 2025, and the 2027 forecast of 35.5% is a normalisation towards the blended level already delivered, not an improvement to be proven.

The forecast itself is set conservatively. Output is projected on the capacity the plant will hold in each period and at a volume management is confident of delivering — not by allocating the contract pipeline of the Growth Plan to forecast periods. That pipeline, together with the regular flow of smaller residential, corporate and OEM orders, represents more demand than the two forecast years absorb, so the projection assumes neither full conversion of the pipeline nor conversion at indicative values, and is better read as a floor set by capacity than as an estimate of the maximum the order book could yield.

Cost structure and operating expenses

Cost of sales comprises materials and hardware procured per project, direct production labour and subcontracted FF&E works, with materials the dominant component. The distinctive feature of the cost base is its operating discipline: overheads were held at EUR 335,668–413,876 per year across 2023–2025 in absolute terms while output grew from EUR 3.9m to EUR 5.0m, taking the OPEX-to-output ratio from 10.6% (2023) to 6.7–6.8% and to 5.3–6.0% in 2026. The 2027 forecast of EUR 421,730 (6.4% of output) stays inside the range already demonstrated — the operating leverage in the projection is one the company has delivered, not one it assumes.

Below-EBITDA charges and net profit dynamics

Depreciation and amortisation rises from EUR 503,111 (2025) to EUR 556,695 (2026F) and EUR 613,776 (2027F) as the new equipment enters the schedule alongside the existing base. Interest on existing facilities has declined for three consecutive years — from EUR 213,720 (2023) to EUR 189,689 (2025), continuing to EUR 180,205 (2026F) and EUR 171,195 (2027F) — a serviced, amortising legacy load. From September 2026 the proposed facility adds EUR 27,408.33 per month, modelled conservatively as fully drawn from the first month; under the execution-linked tranche drawdown of the facility the realised 2026 charge would be at or below the forecast figure. The effective income tax charge runs at 0–2.8% of profit before tax, as the Corporate Income Tax Act substitutes its own schedule of deductible depreciation for the accounting charge and the deductions generated by successive equipment investments reduce the taxable result — to nil in 2025 and, on the same basis, in 2027F. Net profit accordingly holds between EUR 643,205 and EUR 840,752 in the historical years, reaches EUR 1,566,434 in 2026F on the carry-over deliveries, and settles at EUR 1,024,856 in 2027F — a 15.5% net margin, in line with the 12.9–16.0% of 2024–2025.

Growth Plan of VALIYAN LTD

VALIYAN enters the 2026–2027 growth period with an established operational base: a 10,000 m² production complex in Sofia housing fifteen CNC machining centres, edge-banding and boring lines, an in-house finishing line, an upholstery operation and an ERP system; a workforce of more than 120; certification to ISO 9001, ISO 14001, ISO 45001, FSC and EMAS; and a delivery record in Bulgaria and thirteen European export markets under the brand standards of international hotel operators, with at least five multi-site rollout programmes executed each year. The plant already runs several projects in parallel, and two constraints now set the limit on growth. The number of programmes it can carry at once is capped by manual material flow, changeover between project batches and a single finishing line. And four finishing technologies that have become standard positions in premium hospitality and residential specifications — seamless laser edge-banding, three-dimensional membrane-pressed facades, direct UV printing and robotic finishing of complex geometries — are today either subcontracted or left out of the offer. Schedule rather than order intake is the limiting factor: demand already presses against the plant’s parallel capacity.

The 2026 investment programme addresses both constraints through nine equipment sections in two groups, which extend the existing plant into a single Industry 4.0 production complex. Five sections scale throughput: robotic loading and unloading of the CNC centres, an automated panel warehouse, conveyor integration of cutting, edge-banding and boring into a batch-of-one flow with RFID part tracking, a second finishing line with robotic spraying and a vertical drying tower, and a manufacturing execution system with a digital twin layered over the ERP. Four sections bring the premium-finish technologies in-house, converting work that today leaves the company as subcontract coordination into manufacturing margin. The plan takes the company into no new product and, beyond the Spanish call-offs of one existing client’s framework, into no new market: the organisational structure, the project-management system and the client model remain as they are, while the plant multiplies the number of programmes it can run at once and widens the specifications it can accept. The equipment is scheduled for delivery by the end of 2026, so that commissioning precedes the H1 2027 delivery window of the pipeline.

The programme is anchored in a contract pipeline of EUR 16,100,000 across ten engagements with nine distinct counterparties — each identified by name and registration in the investment memorandum and described in this summary by role and market — all in the hospitality segment and spanning its full range from budget and student housing to five-star and luxury properties: three contracts in execution (EUR 2,870,000), four contracts in documentation with commercial terms agreed and contract documents in preparation for signature (EUR 6,790,000) and three letters of intent (EUR 6,440,000). Pipeline-to-financing ratio: 7.0×. Three of the nine counterparties are repeat clients, and their engagements amount to EUR 7,710,000, ~47.9% of the pipeline — the relationship-based repeatability of the business model visible in the order book itself.

Financing Request and Use of Proceeds

The total investment programme is EUR 2,419,050, comprising EUR 2,300,000 funded by the proposed facility and EUR 119,050 funded from the company’s own resources. The facility covers the production equipment of EUR 1,900,400 in full — nineteen items across the nine sections, each a named model of an established European or international manufacturer, priced from supplier quotations — and EUR 399,600 of the software, integration, delivery and commissioning costs that bring the equipment into operation as an integrated line. All equipment is installed within the existing Sofia complex and integrates with the installed machine park and the ERP system.

Allocation of loan proceeds (EUR)

Investment section

Amount

% of total

Growth constraint removed

A1. Robotic loading and unloading of CNC centres

119,800

5.2%

Manual loading confines the fifteen CNC centres to attended single-shift operation.

A2. Automated panel storage and feed

245,900

10.7%

Manual panel handling between store and machines sets the feed pace.

A3. Batch-of-one flow integration

255,000

11.1%

Changeover between project batches; projects processed in sequence rather than in parallel.

A4. Integrated finishing line (application and drying)

524,900

22.8%

One finishing line runs one finish programme at a time and caps lacquered output.

A5. MES shop-floor hardware

18,500

0.8%

No real-time visibility or control of parallel flows.

B1. Laser edge-banding

234,600

10.2%

Seamless (zero-line) edges cannot be produced on the existing park.

B2. Membrane pressing of three-dimensional facades

148,700

6.5%

Curved and relief facades cannot be produced in-house.

B3. Digital UV printing on furniture elements

208,200

9.1%

Printed décor is subcontracted across all segments and carries only a coordination margin.

B4. Robotic finishing cell for three-dimensional parts

144,800

6.3%

Finishing of curved and three-dimensional parts is manual and not reproducible on a series.

Software, integration, delivery, installation and commissioning (facility-funded share)

399,600

17.4%

Without the control software and commissioning the equipment does not operate as an integrated line.

TOTAL

2,300,000

100.0%


Commercial Pipeline

Three stages of certainty are distinguished. Contracts in execution form the 2026 base and are executable on the existing equipment. Contracts in documentation, with commercial terms agreed and documents in preparation for signature, form the 2026–2027 growth layer and depend on the throughput the investment adds. Letters of intent cover two serial programmes and one new-build resort for 2026–2028; they carry lower contractual certainty and are treated as probable rather than committed.

Commercial pipeline (EUR)

#

Counterparty

Project

Country

EUR

Status

1

Hotel development company

New-build hotel of a global operator’s upscale brand, 217 keys

AT

1,200,000

In execution

2

Family-office property investor (owner)

Luxury heritage conversion under an international operator’s collection brand, ~90 keys

FR

900,000

In execution

3

Property developer

Conversion to a global operator’s lifestyle upscale brand, 96 keys

IT

770,000

In execution


Subtotal — contracts in execution


2,870,000


4

Resort owner-operator (repeat client)

Five-star alpine wellness resort, full renovation, 127 keys

AT

1,270,000

In documentation

5

Hospitality investment and management company

Serial conversion of eleven properties of one portfolio to three brands of a global operator, 1,808 keys

DE/BE/FR

4,500,000

In documentation

6

Real-estate developer

Midscale hotel of a global operator in a landmark mixed-use waterfront development, ~170 keys

DE

510,000

In documentation

7

Pan-European property investor (owner)

Luxury heritage conversion under an international operator’s collection brand, 57 keys

FR

510,000

In documentation


Subtotal — contracts in documentation


6,790,000


8

Hostel operator (repeat client)

Flagship design hostel, 610 rooms / 2,500 beds

DE

915,000

Letter of intent

9

Resort owner-operator (repeat client)

New-build premium family resort, 132 keys

DE

725,000

Letter of intent

10

Student-housing and coliving operator (repeat client)

Serial furniture framework for a portfolio pipeline of ~16,000 beds

FR/ES

4,800,000

Letter of intent


Subtotal — letters of intent


6,440,000


Total pipeline


16,100,000


The structure of the pipeline reflects the way the company sells. Its counterparties are the parties that pay in the buyer structure of the segment — developers, property owners, an owner’s management company and owner-operators — while the specifications come from the brand standards of four global hotel groups and from the design practices leading each project. Two serial framework programmes — the eleven-property conversion and the student-housing framework — account for EUR 9,300,000, ~57.8% of the total, and are the format the investment is dimensioned for: one approved specification replicated across a series of properties, called off against opening schedules. Per-key values across the single-property engagements and the rollout track the segment tiers without exception, from approximately EUR 1,500 for the budget hostel to EUR 9,000–10,000 for the luxury and five-star properties — values built up from specification rather than set from a target. Geographically the pipeline sits inside the company’s existing perimeter: no engagement depends on a market where the company has not delivered before, except the Spanish part of the student-housing framework, reached through an existing client, and the whole of it lies within the euro area and the Schengen zone.

Order Book Beyond the Pipeline and the Forecast

The pipeline is the documented growth portfolio, not the whole of the order book. It sets out the principal engagements of the growth layer; the company’s regular intake of hospitality, residential, corporate and OEM projects — contracted in smaller individual values through the operator, architect and design-studio channels, in Bulgaria and on the export markets — continues alongside these engagements and is the base load the plant has carried through every year of its history. The pipeline contains no Bulgarian property: the domestic market, the company’s largest, continues entirely through that regular flow.

The revenue forecast is set conservatively against this demand. Output is projected on what the plant can manufacture in each period and on the volume management is confident of delivering, not by adding the order book together: the engagements above, together with the regular order flow, represent more work than the two forecast years absorb. The projection assumes neither that every engagement signs nor that each converts at its indicative value, and an engagement that is delayed, reduced in scope or not concluded is accommodated within it rather than requiring it to be revised. The forecast is therefore deliberately set below the level the order book would support — a floor established by capacity and delivery confidence, not a ceiling.

Conclusion

The growth plan supports a facility of EUR 2,300,000 within an investment programme of EUR 2,419,050, structured around a defined equipment investment that removes specific, named constraints in an established plant. It is anchored in a production platform built since 1999, in nineteen priced equipment items that integrate with it, and in a commercially grounded pipeline of EUR 16,100,000 across three tiers of certainty, ~47.9% of it with repeat clients. The investment creates both operational capacity and tangible, insurable production assets, and the three contracts in execution are deliverable on the existing plant, so the 2026 base does not depend on the commissioning schedule.

The principal execution risks are characteristic of a capacity-expansion programme of this kind: concentration in the two framework programmes (~57.8% of the pipeline) and in one counterparty group, the two-fifths of the pipeline documented by letters of intent, and the simultaneity of equipment commissioning and the H1 2027 delivery window. They are mitigated by the structure of the plan itself. All three letter-of-intent counterparties are repeat clients, and the contracted and documentation-stage engagements alone amount to EUR 9,660,000, ~60.0% of the pipeline. The equipment serves every contract in the plant rather than the frameworks alone, so the capacity is not stranded if one programme slips. Project contracts are financed by client advances of at least 30% and milestone payments, frameworks are called off property by property, and installation, commissioning, training and a contingency reserve are budgeted within the programme and performed by the manufacturers’ service engineers.

The position the plan builds is that of a European turnkey FF&E partner at premium level, operating on an Industry 4.0 production architecture and able to serve parallel serial programmes and single projects at the same time. Beyond the documented pipeline, development continues along established routes: moving from first projects to series of orders on the nine further European markets where the company has already delivered, entry into adjacent markets through existing operator relationships, and the extension of the own-brand catalogue collections, designer collaborations and OEM channels alongside the project business.

Description of the Loan

To execute the 2026–2027 growth plan and remove the two constraints identified there — the limit on how many programmes the plant can run in parallel, and the finish specifications it cannot produce in-house — VALIYAN intends to obtain a EUR 2,300,000 investment loan. The facility is designed as a single capex package financing the nine-section equipment programme in full and the facility-funded share of the software, integration and commissioning costs that bring it into operation as an integrated line; the balance of the programme is funded from the company’s own resources. It is a targeted instrument: the established business finances its own operations and project working capital through client advances and milestone payments, and the facility funds the one-off equipment programme alone. The draw structure mirrors the staged placement of equipment orders and the practical installation sequence, so funding is available when needed and not held idle.

Indicative facility terms

Parameter

Value

Total facility

EUR 2,300,000

Number of tranches

15

Interest rate

17.9% per annum (fixed)

Loan term per tranche

15 months from drawdown

Servicing

Monthly interest-only on drawn principal

Principal repayment

Bullet at tranche maturity

Total interest cost (if fully drawn for 15 months)

EUR 514,625

Total repayment (principal + interest)

EUR 2,814,625

Tranche schedule and allocation (EUR)

Tranche

Amount

Allocation

Drawdown prerequisite

1–3

450,000

(3 × 150,000)

Robotic CNC loading cell (A1) and automated panel store (A2), with the associated delivery and installation share

Supplier agreements signed; deposit invoices issued for the loading cell and the panel store

4–5

300,000

(2 × 150,000)

Batch-of-one flow integration (A3) and MES shop-floor hardware (A5), with the associated delivery and installation share

Phase 1 equipment ordered or in production; conveyor, buffer and terminal supplier terms confirmed

6–9

600,000

(4 × 150,000)

Second finishing line (A4): spraying robot with conveyor, drying tower and line control, with the associated installation share

Material-flow equipment delivered or in transit; finishing-line supplier agreement executed

10–13

600,000

(4 × 150,000)

Laser edge-banding centre (B1), membrane press (B2) and UV flatbed printer (B3), with the associated delivery share

Finishing-line installation commenced; capability-extension supplier terms confirmed

14–15

350,000

(150,000 + 200,000)

Robotic finishing cell (B4) and the facility-funded balance of software, integration and commissioning

Core automated contour installed; integration and commissioning of the combined flow commenced

Total

2,300,000


The facility is structured to match how the capex is actually executed. The fifteen tranches are grouped in five drawdown phases that follow the installation sequence of the production chain — the material-flow foundation first, then the flow integration and its control layer, then finishing capacity, then the capability-extension technologies, and the commissioning balance last — with each drawdown conditional on the documented execution progress that makes the next category of spending operationally necessary. Interest accrues only on amounts actually drawn, so the monthly obligation rises in defined steps as capital is converted into productive assets rather than reaching its maximum at inception, and each tranche matures fifteen months after its own drawdown — after the financed sections have been commissioned and the delivery window of the growth-layer contracts has passed, at the point where the expanded plant is generating settlements from completed projects. This design links every draw to a defined project step, without mixing purposes or leaving material amounts undrawn or idle.


Risk scoring

Total risk scoreAA
Debt to equity0.32
LTV12%
Credit history9 / 10
Collateral typeExisting operational assets

Rating AA (the second tier) rests on more than 25 years of continuous, profitable operations, an owned and certified production complex, and collateral that covers the facility many times over. Every reported period since 2023 closed with a net profit, and existing bank facilities have been serviced without disruption.

  • D/E (Debt-to-equity) of 0.32 is low for an industrial manufacturer;
  • LTV of 12% means hard collateral at liquidation value covers the €2.3M facility about 8.4 times;
  • Credit history score of 9/10.

Keep in mind:

  • Strategy and key client relationships are concentrated among the two founder-owners;
  • all production is based at a single insured site in Sofia;
  • hospitality (the largest segment) moves with the hotel investment cycle;
  • about 58% of the pipeline is concentrated in two serial framework programs.

Execution risks and mitigants

The principal execution risks are characteristic of a capacity-expansion programme of this kind: concentration in the two framework programmes (~57.8% of the pipeline) and in one counterparty group, the two-fifths of the pipeline documented by letters of intent, and the simultaneity of equipment commissioning and the H1 2027 delivery window.

They are mitigated by the structure of the plan itself. All three letter-of-intent counterparties are repeat clients, and the contracted and documentation-stage engagements alone amount to EUR 9,660,000, ~60.0% of the pipeline. The equipment serves every contract in the plant rather than the frameworks alone, so the capacity is not stranded if one programme slips. Project contracts are financed by client advances of at least 30% and milestone payments, frameworks are called off property by property, and installation, commissioning, training and a contingency reserve are budgeted within the programme and performed by the manufacturers’ service engineers. The three contracts in execution are deliverable on the existing plant, so the 2026 base does not depend on the commissioning schedule.

Financials

Output 2025€5.00M
Net profit 2026 YTD€1.27M
Gross margin36.9%
Pipeline€16.1M
€ millions
€3.89M3.89
+29%€5.01M5.01
−0%€5.00M5.00
+22%€6.12M*6.12*
+8%€6.59M*6.59*
2023202420252026F2027F

* 2026–2027 are management forecasts; 2026 net profit includes projects manufactured in 2025 and delivered in 2026

VALIYAN

VALIYAN currently has a €16.1M pipeline across 10 hotel projects. However, management uses conservative forecasts and does not assume that the full pipeline will convert into revenue. The growth forecasts below are therefore based mainly on the company’s available production capacity.

Growing production

  • Production output increased from €3.89M in 2023 to €5.01M in 2024 — a 28.9% increase.
  • Output stayed around €5.0M in 2025, as several large projects were still in production and were completed and delivered in 2026.
  • As the new production capacity comes online, output is forecast to reach €6.12M in 2026 and €6.59M in 2027.

Strong profitability

  • The company made a net profit every year from 2023 to 2025, between €643k and €841k.
  • In just January–August 2026, net profit reached €1.27M, helped by the delivery of projects carried over from 2025.
  • Gross margin is around 37% across 2025–2026.
  • The 2027 forecast assumes a slightly lower 35.5% margin, which is considered a normal level for the business.

Better cost efficiency

  • Annual overhead costs stayed relatively stable at €336k–€414k, even as production increased.
  • As a result, operating expenses fell from 10.6% of output to below 7%.

Market

European contract furniture is a €47.3B market growing ~4.6% a year, with hospitality its largest end use. Hotel openings in Europe rise from 259 in 2025 to a forecast 319 in 2026, each carrying a full FF&E package on a hard deadline, and a 3-million-bed student-housing gap adds serial framework demand. The main risk is the cycle: FF&E is deferred first when hotel financing tightens.

Financial performance

On the reported figures, VALIYAN shows a steadily scaling, consistently profitable operation: production output rose from EUR 3,886,328 (2023) to EUR 5,010,148 (2024), held that level at EUR 5,004,014 (2025), and steps up to EUR 6,123,651 (2026F) and EUR 6,593,590 (2027F) as the capacity added under the facility comes on line. Every period closed with a net profit — EUR 643,205 to EUR 840,752 in the historical years and EUR 1,268,210 in January–August 2026 alone. Output growth by year: +28.9% (2024), (0.1%) (2025), +22.4% (2026F), +7.7% (2027F).

One reading note applies to every table below. The company manufactures to order and reports on production output — revenue plus the change in work in progress — because a project still in production at a year-end recognises its revenue only on delivery and acceptance. Output measures what was manufactured in the period regardless of delivery timing, and every margin is calculated on it. This reconciles the swing in reported revenue between 2025 (EUR 2,950,666, with EUR 2,053,348 added to work in progress) and 2026 (EUR 7,732,862, when those projects were delivered and invoiced): activity across the two years was stable and rising, only the delivery schedule moved.

Income statement, EUR (2023–2025)

Metric202320242025
Revenue5,058,2115,264,7732,950,666
— product revenue4,988,1645,109,3402,846,362
— services revenue70,047155,433104,304
Change in work in progress(1,171,883)(254,625)2,053,348
Production output3,886,3285,010,1485,004,014
Cost of sales(2,663,590)(3,391,375)(3,506,180)
Gross profit1,222,7381,618,7731,497,834
Operating expenses(413,876)(338,499)(335,668)
EBITDA808,8621,280,2741,162,166
Depreciation and amortisation(395,229)(433,576)(503,111)
EBIT413,633846,698659,055
Financial income664,679191,222175,884
Financial expenses(214,743)(213,209)(191,734)
— interest on existing facilities(213,720)(210,141)(189,689)
— other financial expense(1,023)(3,068)(2,045)
Net financial result449,936(21,987)(15,850)
Profit before tax863,569824,711643,205
Income tax(22,817)(23,209)—
Net profit840,752801,502643,205

January–August 2026 actuals

Metric2026 (Jan–Aug)
Revenue5,514,259
— product revenue5,348,831
— services revenue165,428
Change in work in progress(1,284,987)
Production output4,229,272
Cost of sales(2,336,943)
Gross profit1,892,329
Operating expenses(225,957)
EBITDA1,666,372
Depreciation and amortisation(371,130)
EBIT1,295,242
Financial income126,081
Financial expenses(120,137)
Net financial result5,944
Profit before tax1,301,186
Income tax(32,976)
Net profit1,268,210

The eight months already reported for 2026 exceed the full-year EBIT and net profit of every historical year, as the carry-over projects manufactured in 2025 were delivered and invoiced and EUR 1,284,987 was released from work in progress.

Forecast 2026F–2027F

Metric2026F (Sep–Dec)2026F (FY)2027F
Revenue2,218,6037,732,8626,740,748
— product revenue2,152,0457,500,8766,538,526
— services revenue66,558231,986202,222
Change in work in progress(324,224)(1,609,211)(147,158)
Production output1,894,3796,123,6516,593,590
Cost of sales(1,183,196)(3,520,139)(4,249,662)
Gross profit711,1832,603,5122,343,928
Operating expenses(112,978)(338,935)(421,730)
EBITDA598,2052,264,5771,922,198
Depreciation and amortisation(185,565)(556,695)(613,776)
EBIT412,6401,707,8821,308,422
Financial income63,040189,121189,121
Financial expenses(169,701)(289,838)(472,687)
— interest on existing facilities(60,068)(180,205)(171,195)
— interest on the proposed facility(109,633)(109,633)(301,492)
Net financial result(106,661)(100,717)(283,566)
Profit before tax305,9791,607,1651,024,856
Income tax(7,755)(40,731)—
Net profit298,2241,566,4341,024,856

Growth and margin indicators

Metric2023202420252026 Jan–Aug2026F Sep–Dec2026F FY2027F
Output growth—28.9%(0.1%)——22.4%7.7%
Gross profit margin31.5%32.3%29.9%44.7%37.5%42.5%35.5%
OPEX / Output10.6%6.8%6.7%5.3%6.0%5.5%6.4%
EBITDA margin20.8%25.6%23.2%39.4%31.6%37.0%29.2%
EBIT margin10.6%16.9%13.2%30.6%21.8%27.9%19.8%
Net margin21.6%16.0%12.9%30.0%15.7%25.6%15.5%

The trajectory is one of controlled scale-up rather than volatility: a 28.9% step in 2024, a deliberately held level in 2025 while a large block of orders remained in production for 2026 delivery, and forecast growth of 22.4% and 7.7% as the expanded capacity comes on line. Gross margin tells the same story once 2025 and 2026 are read as the single production-and-delivery cycle they form: the blended margin across the two years — gross profit of EUR 4,101,346 on output of EUR 11,127,665, or 36.9% — is the representative figure. The elevated single-period readings of 2026 (44.7% in January–August, 42.5% for the full year) are the counterpart of the lower revenue reported in 2025, and the 2027 forecast of 35.5% is a normalisation towards the blended level already delivered.

The forecast is set conservatively. Output is projected on the capacity the plant will hold in each period and at a volume management is confident of delivering — not by allocating the contract pipeline to forecast periods. That pipeline, together with the regular flow of smaller residential, corporate and OEM orders, represents more demand than the two forecast years absorb, so the projection is better read as a floor set by capacity than as an estimate of the maximum the order book could yield.

Below-EBITDA charges and net profit

Depreciation and amortisation rises from EUR 503,111 (2025) to EUR 556,695 (2026F) and EUR 613,776 (2027F) as the new equipment enters the schedule. Interest on existing facilities has declined for three consecutive years — from EUR 213,720 (2023) to EUR 189,689 (2025), continuing to EUR 180,205 (2026F) and EUR 171,195 (2027F) — a serviced, amortising legacy load. From September 2026 the proposed facility adds EUR 27,408.33 per month, modelled conservatively as fully drawn from the first month; under the execution-linked tranche drawdown the realised 2026 charge would be at or below the forecast figure.

The effective income tax charge runs at 0–2.8% of profit before tax, as the Corporate Income Tax Act substitutes its own schedule of deductible depreciation for the accounting charge and the deductions generated by successive equipment investments reduce the taxable result — to nil in 2025 and, on the same basis, in 2027F. Net profit accordingly holds between EUR 643,205 and EUR 840,752 in the historical years, reaches EUR 1,566,434 in 2026F on the carry-over deliveries, and settles at EUR 1,024,856 in 2027F — a 15.5% net margin, in line with the 12.9–16.0% of 2024–2025.

Growth plan

VALIYAN enters 2026–2027 with an established operational base and two constraints that now set the limit on growth. The number of programmes the plant can carry at once is capped by manual material flow, changeover between project batches and a single finishing line. And four finishing technologies that have become standard positions in premium hospitality and residential specifications — seamless laser edge-banding, three-dimensional membrane-pressed facades, direct UV printing and robotic finishing of complex geometries — are today either subcontracted or left out of the offer. Schedule rather than order intake is the limiting factor: demand already presses against the plant’s parallel capacity.

The 2026 investment programme addresses both constraints through nine equipment sections in two groups — five that scale throughput and four that bring the premium finishes in-house (itemised in the collateral section under Financing request and use of proceeds). The plan takes the company into no new product and, beyond the Spanish call-offs of one existing client’s framework, into no new market. The equipment is scheduled for delivery by the end of 2026, so that commissioning precedes the H1 2027 delivery window of the pipeline.

Commercial pipeline

The programme is anchored in a contract pipeline of EUR 16,100,000 across ten engagements with nine distinct counterparties — all in the hospitality segment, from budget and student housing to five-star and luxury properties. Three stages of certainty are distinguished: contracts in execution form the 2026 base and are executable on the existing equipment; contracts in documentation, with commercial terms agreed and documents in preparation for signature, form the 2026–2027 growth layer; letters of intent cover two serial programmes and one new-build resort for 2026–2028 and are treated as probable rather than committed. Pipeline-to-financing ratio: 7.0×. Three of the nine counterparties are repeat clients, and their engagements amount to EUR 7,710,000, ~47.9% of the pipeline.

#CounterpartyProjectCountryEURStatus
1Hotel development companyNew-build hotel of a global operator’s upscale brand, 217 keysAT1,200,000In execution
2Family-office property investorLuxury heritage conversion under an international operator’s collection brand, ~90 keysFR900,000In execution
3Property developerConversion to a global operator’s lifestyle upscale brand, 96 keysIT770,000In execution
Subtotal — in execution2,870,000
4Resort owner-operator (repeat client)Five-star alpine wellness resort, full renovation, 127 keysAT1,270,000In documentation
5Hospitality investment and management companySerial conversion of eleven properties to three brands of a global operator, 1,808 keysDE/BE/FR4,500,000In documentation
6Real-estate developerMidscale hotel of a global operator in a landmark waterfront development, ~170 keysDE510,000In documentation
7Pan-European property investorLuxury heritage conversion under an international operator’s collection brand, 57 keysFR510,000In documentation
Subtotal — in documentation6,790,000
8Hostel operator (repeat client)Flagship design hostel, 610 rooms / 2,500 bedsDE915,000Letter of intent
9Resort owner-operator (repeat client)New-build premium family resort, 132 keysDE725,000Letter of intent
10Student-housing and coliving operator (repeat client)Serial furniture framework for a portfolio pipeline of ~16,000 bedsFR/ES4,800,000Letter of intent
Subtotal — letters of intent6,440,000
Total pipeline16,100,000

The counterparties are the parties that pay in the buyer structure of the segment — developers, property owners, an owner’s management company and owner-operators — while the specifications come from the brand standards of four global hotel groups and the design practices leading each project. Two serial framework programmes — the eleven-property conversion and the student-housing framework — account for EUR 9,300,000, ~57.8% of the total, and are the format the investment is dimensioned for. Per-key values track the segment tiers without exception, from approximately EUR 1,500 for the budget hostel to EUR 9,000–10,000 for the luxury and five-star properties. No engagement depends on a market where the company has not delivered before, except the Spanish part of the student-housing framework, reached through an existing client; the whole pipeline lies within the euro area and the Schengen zone.

The pipeline is the documented growth portfolio, not the whole of the order book: the regular intake of hospitality, residential, corporate and OEM projects — contracted in smaller individual values in Bulgaria and on the export markets — continues alongside these engagements and is the base load the plant has carried through every year of its history. The pipeline contains no Bulgarian property: the domestic market, the company’s largest, continues entirely through that regular flow.

Market assessment

VALIYAN operates in the European contract furniture market as a custom manufacturer and turnkey FF&E contractor. The relevant picture has two dimensions: the European contract furniture segment, which grows faster than the furniture industry overall and has hospitality as its largest end use, and the Bulgarian home market, where the company ranks among the largest specialised players of a fragmented industry. The demand engines most relevant to the order book are the European hotel development cycle, at record levels and accelerating through 2026–2027, and the structurally undersupplied student-housing sector.

European contract furniture and the hospitality cycle

The European furniture market overall is valued at approximately EUR 211 billion in 2025, projected to reach EUR 282 billion by 2034 at a CAGR of ~3.3% (IMARC). The company’s addressable layer is contract furniture — furniture procured by businesses and institutions under project contracts — valued at approximately EUR 47.3 billion in 2025 and growing to EUR 70.7 billion by 2034 at a CAGR of ~4.6% (Market Data Forecast), with Technavio projecting 5.1% annual growth over 2024–2029 and identifying hospitality as the largest end-use segment in Europe. Germany and France, the two largest national contract markets at ~18.2% each, are also among Europe’s largest hotel development markets and sit on the company’s established road-logistics route from Sofia.

The hospitality demand engine is running at record levels. Europe’s hotel construction pipeline stood at 1,731 projects with 255,354 rooms at the close of Q1 2026, and openings are accelerating: 259 hotels opened in 2025, with 319 forecast for 2026 and 311 for 2027 (Lodging Econometrics) — each carrying a complete FF&E package with a hard deadline. The mix is shifting upward: FF&E budgets rise from approximately EUR 4,600–9,200 per key in midscale to EUR 11,000–20,200 in upscale and EUR 32,200 to beyond EUR 53,400 in luxury (DataDrivenAEC), so growth concentrated in the upper tiers rewards suppliers able to meet premium finish specifications. Hotel casegoods are renewed on brand-mandated replacement cycles of 7–10 years regardless of visual condition, and European buyers are shifting toward shorter, regional supply chains (CSIL), which favours suppliers producing inside the EU.

Student housing and coliving

Europe faces a shortage of some 3 million student beds, projected to widen by a further 200,000 over five years against a private purpose-built stock of only around 0.8 million beds; JLL estimates the investment required to close the gap at approximately EUR 450 billion, and the EU and UK student population of 21.7 million is forecast to grow a further ~10% by 2030/31. Each bed requires a standardised furniture package produced in series — the serial production profile for which the company’s modernisation is dimensioned, and the sector behind the student-housing framework in its pipeline.

Domestic market and competitive position

Bulgaria’s furniture industry produced goods worth approximately EUR 535 million in 2024 — a record — with approximately 22,000 people employed across a fragmented base of small and medium producers. Domestic consumption peaked at approximately EUR 503 million, imports set a record of EUR 471 million led by China with a 30% share, and exports of EUR 501 million flow mainly to Romania, Greece and Poland. The domestic market is growing but small relative to the company’s addressable European demand, and the import pressure that squeezes mass-market producers does not reach the certified project segment with the same force, since branded hospitality procurement is decided on specification compliance and delivery reliability rather than on catalogue price.

Two structural transitions have strengthened the position of a Bulgarian exporter: full Schengen membership from 1 January 2025 removed land-border checks on the road corridors to central and western Europe, and euro adoption from 1 January 2026 completed the alignment of revenue and cost base in one currency. The EU Deforestation Regulation, chain-of-custody certification (FSC, ISO 14001, EMAS) and the brand standards of international hotel operators together form an entry barrier that certified supply chains absorb far more easily than uncertified ones.

Competition is structured by supplier type rather than by country. At the top of the price range, branded European design houses — B&B Italia, Poltrona Frau, Pedrali, Wittmann — dominate the visible part of luxury public areas but are catalogue-led: full-property custom packages and cross-border installation are not their core model. At the price-led end stand local joineries, Turkish turnkey contractors and Chinese exporters, which anchor pricing but rarely clear the certification, brand-standard and cross-border installation requirements of branded serial programmes. VALIYAN competes in the middle tier of custom contract manufacturers and turnkey FF&E contractors as an EU-inside supplier, holding the premium end of the tier where serial programmes and complex custom work meet.

Opportunities

  • An accelerating opening cycle. Hotel openings rise from 259 (2025) to a forecast 319 (2026) and 311 (2027), concentrated in the United Kingdom, Germany, France and Portugal — inside the company’s delivery geography and exactly in the window in which its enlarged capacity comes on line.
  • Premiumisation of the pipeline. Record project counts in upper upscale and luxury shift the mix toward FF&E budgets of approximately EUR 11,000–53,400 per key, where custom capability and complex finishes carry the margin — the part of the market least accessible to price-led suppliers.
  • A structural renewal market. Brand-mandated 7–10-year replacement cycles make Europe’s installed branded room stock a recurring market independent of new construction, favouring incumbents with existing brand qualifications.
  • Student housing’s supply gap. A 3-million-bed shortage and an estimated EUR 450 billion investment requirement underpin a multi-year construction programme procured in framework series — exactly the format the company’s plan anticipates.
  • EU-inside advantage in a nearshoring market. The shift toward shorter, regional supply chains, reinforced by Schengen membership and euro adoption, converts the company’s location into a commercial argument: intra-EU road delivery without border friction, invoicing in the buyer’s currency, EU compliance by default.

Challenges

  • Hotel capital expenditure is cyclical. FF&E is spent at the end of development projects and deferred first when financing tightens; the record early-planning stage of 604 projects is a stock of intentions, not commitments, and the 2023 contraction of the European furniture market (−3.5%, CSIL) illustrates the sector’s sensitivity to the cycle.
  • Structural cost competition from non-EU suppliers. Turkish contract manufacturers combine low cost with proximity, and Chinese exporters anchor the price-led end of every tender; the company does not compete at their price points, but their presence caps the premium a certified EU supplier can charge.
  • Skilled labour is the binding input. The industry chamber lists the shortage of skilled workers among the sector’s principal problems, and wage convergence erodes the regional cost advantage over time — one of the pressures the automation programme is designed to offset.
  • A modest-growth market overall. Contract furniture grows at ~4.6–5.1% a year; growth of the scale the company plans must come from share gains in the hospitality and serial segments rather than from market growth alone.
  • Regulatory and transition costs. The EU Deforestation Regulation adds documentation and due-diligence cost across the timber chain, and the euro transition carries dual-pricing obligations until August 2026; both weigh more heavily on smaller suppliers, but neither is costless for the company.

Collateral breakdown

Production machinery (11 groups, CNC park) · €12.4M€6.8M€6.6M
Production machinery (11 groups, CNC park)€12,425,730
Technical installations of the plant€6,843,790
Production facility, 10,000 m²€6,630,000
Industrial land plot, 18,000 m²€2,500,000
Loan-financed equipment (first-priority pledge)€1,900,400
Total pledged€30,299,920Replacement value of the Sofia complex plus purchase value of the new equipment. Registered via Maclear AG.

The €2.3M facility is backed by substantial physical assets owned by VALIYAN.

1. New machinery bought with the loan — €1.9M

Most of the loan, €1.9M, is being used to buy new production equipment.

  • The machines will be specifically identified by serial number and invoices.
  • They will be insured and remain at VALIYAN’s Sofia production site.
  • The lender is granted first-priority security over these machines.

So, the new machinery bought with the loan is pledged as collateral.

2. Existing factory and equipment

VALIYAN is also pledging its existing Sofia industrial complex, which includes:

  • 18,000 m² of industrial land
  • 10,000 m² production facility
  • Existing production machinery, including the CNC equipment
  • Other technical installations

So the lender is not relying only on the new machinery. The company's existing factory and equipment also provide security.

Even after applying these conservative values, the collateral is estimated to cover:

  • 8.4× the €2.3M loan principal
  • 7.1× the total €2.71M repayment

This means that there is significantly more physical collateral than the loan amount. The company does not need to include inventory or unpaid customer invoices to reach this level of coverage.

The remaining €0.4M of the facility is for software, integration, and commissioning. These costs do not create a separate physical asset that could easily be sold, so they are not included in the collateral calculation. The security is registered through Maclear AG. Each time money is drawn from the facility, it is used to acquire or install an asset that becomes pledged and insured in favour of the lender.

Loan collateral

The EUR 2,300,000 facility is secured by a consolidated collateral package built on two hard-asset layers: the equipment acquired through the loan-financed investment programme, offered as first-priority pledged collateral, and the company’s existing operational asset base — the land, buildings, machinery and technical installations of the Sofia production complex. Collateral is presented at base value (invoice purchase cost for the new equipment, current replacement value for the existing assets) and at a conservative liquidation value on an orderly forced-sale basis, with defined recoveries of 40–75% by asset category.

Of the facility, EUR 1,900,400 (82.6%) is deployed into tangible, serial-numbered equipment that forms the pledgeable loan-financed base; the remaining EUR 399,600 (17.4%), covering software, integration, delivery and commissioning, produces no separable recoverable asset and is excluded from the collateral base. No encumbrances over the existing asset base have been reported by the company; the ranking and registration of the security will be established in the facility documentation.

Hard collateral summary, EUR

Collateral sourceBase valueLiquidation valueCoverage of principal (liquidation)
Loan-financed equipment (first-priority pledge)1,900,4001,420,67561.8%
Existing operational assets (land, buildings, machinery, installations)28,399,52017,951,5267.8×
Total hard collateral30,299,92019,372,2018.4×

The scale of the existing base is the defining feature of the package. The Sofia complex enters the collateral at a current replacement value of EUR 28,399,520: a serviced industrial land plot of approximately 18,000 m² (EUR 2,500,000, 75% recovery), the purpose-built, insured 10,000 m² production facility with its administrative part (EUR 6,630,000, 70%), eleven groups of production machinery totalling EUR 12,425,730 (70%) — woodworking machinery of leading European manufacturers with an established pan-European secondary market, led by the CNC machining and nesting park of EUR 4,445,000 — and the plant’s technical installations of EUR 6,843,790, carried at a conservative 40% because their realisable value is principally as part of the property complex. The loan-financed layer adds the nine equipment sections of the growth plan at a 75% recovery, with the MES shop-floor hardware at the standard 50% IT-hardware discount.

Coverage of principal and of the total repayment obligation

Coverage metricAt base valueAt liquidation value
Hard collateral vs EUR 2,300,000 principal13.2×8.4×
Hard collateral vs EUR 2,711,125 total repayment (principal + interest)11.2×7.1×

On a conservative liquidation basis the package provides multiple coverage of the facility from hard assets alone: the pledged new equipment covers 61.8% of principal by itself, the existing operational base covers principal 7.8 times on its own, and the combined hard collateral covers principal 8.4× and the full repayment obligation 7.1× — no supplementary layers of inventory or receivables are required. The package strengthens as the programme is executed: each drawdown converts directly into a pledged asset installed at the complex and insured in favour of the lender. The primary repayment source remains the company’s operating cash flow, with the collateral providing downside protection at a multiple of the exposure.

Financing request and use of proceeds

The total investment programme is EUR 2,419,050, comprising EUR 2,300,000 funded by the facility and EUR 119,050 funded from the company’s own resources. The facility covers the production equipment of EUR 1,900,400 in full — nineteen items across nine sections, each a named model of an established European or international manufacturer, priced from supplier quotations — and EUR 399,600 of the software, integration, delivery and commissioning costs that bring the equipment into operation as an integrated line. All equipment is installed within the existing Sofia complex and integrates with the installed machine park and the ERP system.

Investment sectionEUR%Growth constraint removed
A1. Robotic loading and unloading of CNC centres119,8005.2%Manual loading confines the fifteen CNC centres to attended single-shift operation.
A2. Automated panel storage and feed245,90010.7%Manual panel handling between store and machines sets the feed pace.
A3. Batch-of-one flow integration255,00011.1%Changeover between project batches; projects processed in sequence rather than in parallel.
A4. Integrated finishing line (application and drying)524,90022.8%One finishing line runs one finish programme at a time and caps lacquered output.
A5. MES shop-floor hardware18,5000.8%No real-time visibility or control of parallel flows.
B1. Laser edge-banding234,60010.2%Seamless (zero-line) edges cannot be produced on the existing park.
B2. Membrane pressing of three-dimensional facades148,7006.5%Curved and relief facades cannot be produced in-house.
B3. Digital UV printing on furniture elements208,2009.1%Printed décor is subcontracted across all segments and carries only a coordination margin.
B4. Robotic finishing cell for three-dimensional parts144,8006.3%Finishing of curved and three-dimensional parts is manual and not reproducible on a series.
Software, integration, delivery, installation and commissioning399,60017.4%Without the control software and commissioning the equipment does not operate as an integrated line.
Total2,300,000100.0%

Description of the loan

To execute the 2026–2027 growth plan, VALIYAN takes a EUR 2,300,000 investment loan designed as a single capex package: it finances the nine-section equipment programme in full and the facility-funded share of the software, integration and commissioning costs, while the established business finances its own operations and project working capital through client advances and milestone payments. The draw structure mirrors the staged placement of equipment orders and the practical installation sequence, so funding is available when needed and not held idle.

Indicative facility terms

ParameterValue
Total facilityEUR 2,300,000
Number of tranches15
Interest rate17.9% per annum (fixed)
Loan term per tranche15 months from drawdown
ServicingMonthly interest-only on drawn principal
Principal repaymentBullet at tranche maturity
Total interest cost (fully drawn for 15 months)EUR 514,625
Total repayment (principal + interest)EUR 2,814,625

Tranche schedule and allocation, EUR

TrancheAmountAllocationDrawdown prerequisite
1–3450,000 (3 × 150,000)Robotic CNC loading cell (A1) and automated panel store (A2), with the associated delivery and installation shareSupplier agreements signed; deposit invoices issued for the loading cell and the panel store
4–5300,000 (2 × 150,000)Batch-of-one flow integration (A3) and MES shop-floor hardware (A5)Phase 1 equipment ordered or in production; conveyor, buffer and terminal supplier terms confirmed
6–9600,000 (4 × 150,000)Second finishing line (A4): spraying robot with conveyor, drying tower and line controlMaterial-flow equipment delivered or in transit; finishing-line supplier agreement executed
10–13600,000 (4 × 150,000)Laser edge-banding centre (B1), membrane press (B2) and UV flatbed printer (B3)Finishing-line installation commenced; capability-extension supplier terms confirmed
14–15350,000 (150,000 + 200,000)Robotic finishing cell (B4) and the facility-funded balance of software, integration and commissioningCore automated contour installed; integration and commissioning of the combined flow commenced
Total2,300,000

The fifteen tranches are grouped in five drawdown phases that follow the installation sequence of the production chain — the material-flow foundation first, then the flow integration and its control layer, then finishing capacity, then the capability-extension technologies, and the commissioning balance last — with each drawdown conditional on the documented execution progress that makes the next category of spending operationally necessary. Interest accrues only on amounts actually drawn, so the monthly obligation rises in defined steps as capital is converted into productive assets, and each tranche matures fifteen months after its own drawdown — after the financed sections have been commissioned and the delivery window of the growth-layer contracts has passed.

How the loan pays out

Your 012345678901234567890,012345678901234567890012345678901234567890012345678901234567890 USDC investment behaves like a 10-month bond: monthly interest payments, then principal back at month 012345678901234567890.

DateInterestPrincipalTotal
Net profit+012345678901234567890.012345678901234567890012345678901234567890 USDC
Total return012345678901234567890.012345678901234567890012345678901234567890 USDC

Borrower

VALIYAN LTDSofia, Bulgaria · founded 1999
VALIYAN LTD

VALIYAN LTD is a Bulgarian manufacturer of premium-segment furniture and a turnkey FF&E (furniture, fixtures and equipment) contractor for international hotel operators, wellness resort chains, corporate and retail clients and owners of premium residential property. Founded in Sofia in November 1999 by two partners who began in a small rented workshop, the company has grown over more than a quarter of a century into an international supplier executing the full production cycle — concept development and technical documentation, cutting, facade production, finishing lacquer, upholstery and assembly, international logistics and installation on site — at its own 10,000 m² production complex in Sofia. It has completed several hundred projects across its home market and thirteen European export markets, runs at least five multi-site rollout programmes each year and reports a consistently high share of repeat clients. The proposed financing funds the next stage of a development sequence the company has completed repeatedly through successive investment cycles: the transition of the plant to an Industry 4.0 architecture, together with premium-segment finishing technologies.

Reg No: 130122979valiyan.com

About the company

VALIYAN LTD is a Bulgarian manufacturer of premium-segment furniture and a turnkey FF&E (furniture, fixtures and equipment) contractor for international hotel operators, wellness resort chains, corporate and retail clients and owners of premium residential property. Founded in Sofia in November 1999 by two partners who began in a small rented workshop, the company has grown into an international supplier executing the full production cycle — concept development and technical documentation, cutting, facade production, finishing lacquer, upholstery and assembly, international logistics and installation on site — at its own 10,000 m² production complex in Sofia.

It has completed several hundred projects across its home market and thirteen European export markets, runs at least five multi-site rollout programmes each year and reports a consistently high share of repeat clients. The workforce exceeds 120, the majority of it in production. The company holds ISO 9001, ISO 14001, ISO 45001, FSC and EMAS certification — the supplier-qualification threshold of international hotel operators — and has been recognised as one of the greenest industrial companies in the country for the energy-saving and waste-processing systems of its plant.

Corporate identifiers: VALIYAN LTD (ВАЛИЯН ООД), a Bulgarian limited liability company; EIK 130122979; VAT BG130122979; registered 02.11.1999; registered office 7 Obelsko Shose Street, Lyulin district, Sofia 1360, Bulgaria; share capital EUR 2,556, fully paid, held equally by the two founders.

Ownership, leadership and governance

The company is owned and managed by its founders, Valentin Nikolaev Georgiev and Yankul Georgiev Yankov, each holding 50% of the capital and a director’s mandate with the right of sole representation — the same two-director model that has run the company since 1999 without documented disruption. One director leads design and the client-facing side, the other production; commercial and financial matters are shared.

Day-to-day operational management and the company’s public representation have passed to a second-generation team of commercial and technical leaders, while the founders retain ownership control and strategic direction. The concentration of strategy and principal client relationships in the two owner-managers gives speed of decision at the cost of key-person dependency — a trade-off structural to a family-owned manufacturer at this scale, mitigated by the functional heads and middle-management layer beneath the directors.

Business model and revenue mechanics

VALIYAN manufactures to order — nothing is made for stock — and sells one vertically integrated production core through five reinforcing commercial formats:

  • Turnkey FF&E project contracts — the principal revenue stream: complete interior packages engineered, produced, delivered and installed under one contract, including multi-site rollout programmes in which one approved specification is replicated across a series of properties.
  • Bespoke residential interiors — complete furnishing of luxury residences, channelled through leading architectural practices and the Sofia showroom, at margins above the company average.
  • Own-brand catalogue collections — a standardised line of upholstered furniture made to order in configurable fabric, leather and finish options, with a short order cycle and no repeated engineering.
  • Designer collaborations — joint lines with invited international designers and architects, shown at leading industry exhibitions; the format earns reputation and the designer network that channels project orders.
  • OEM production — custom furniture ordered by international design studios under their own name, a growing format whose economics rest on repeat orders without new client acquisition.

Pricing follows project economics rather than a price list: each proposal builds up the full cost of the package — materials, own production, subcontracted works, logistics and installation — and adds margin at three points: on in-house manufacturing, on the coordination of subcontracted components, and on the management of the project as a whole.

The payment structure de-risks the cycle: an advance of at least 30% at signature, interim tranches tied to production and installation milestones, and final settlement on acceptance. Material prices are fixed with suppliers at quotation, and every contract, domestic and export, is denominated and settled in euro. Repeat revenue is built on relationships: hotel operators return on the 7–10-year renewal cycle of their room stock, one delivered brand standard converts into rollout series, and in residential work the architectural practice — not the end client — is the recurring counterparty.

Product portfolio and geographic footprint

The portfolio is organised in four product groups, combined into one turnkey package in hospitality, wellness, corporate and retail projects:

  • Casegoods and built-in furniture — the production core: wardrobes, cabinets, tables, reception desks, minibar units and headboards, kitchens, bathroom modules, wall panelling, door systems and built-in integrations, in FSC-certified solid wood and veneer, solid-surface composites, brass, stainless steel, glass, stone and marble.
  • Upholstered furniture — project orders to individual specification and the own-brand line of sofas and armchairs, produced on the complex’s own upholstery line.
  • FF&E components and integration — lighting, curtains and textiles, mirrors, decorative elements and special finishes, partly in-house and partly through specialised subcontractors within the one client contract.
  • Designer furniture and collaborations — an award-recognised line created with international design studios; the company has debuted at the leading world furniture exhibition as part of the national stand.

Bulgaria is the home and largest market, where the company is present across all four client segments. Completed projects span thirteen export markets — Austria, Germany, Switzerland, France, the United Kingdom, Italy, the Netherlands, Denmark, Belgium, Hungary, Romania, Croatia and Norway — with the DACH region the largest export cluster. Deliveries run by road within the single market without customs procedures; orders outside the EU arrive through the OEM design-studio channel. Spain, Portugal, Greece, Poland, the Czech Republic, Slovenia and Scandinavia are identified for expansion through the operator and studio relationships established on current markets.

Key clients and go-to-market

The company sells B2B into the project supply chains of five buyer groups: international hotel operators, contracting both room-stock renewal programmes and new openings; wellness and spa resort chains, served with series of properties to a common specification; owners of premium residential property, engaging through leading architectural practices; corporate and retail clients, commissioning headquarters, offices, premium retail spaces and specialised educational facilities; and international design studios in the OEM format.

The buyer structure shapes the selling: in hospitality the brand’s design or technical department specifies while the developer, owner or management company pays, and one delivered brand standard qualifies the company across that brand’s other properties and developers; in corporate and residential work the architectural practice is the gatekeeper, and one practice tends to bring a sequence of projects for different end clients. Clients and counterparties are described here by role rather than named, each being identified in the investment memorandum.

Production platform

The execution model keeps the critical value chain in-house: engineering and brand-standards knowledge, CNC machining across fifteen centres, facade production, finishing lacquer on a line recovering up to 97% of process heat, the upholstery cycle, project management and the company’s own installation crews. Auxiliary and narrow-specialism works — lighting, textiles, stone and metal specialities, international transport, customs brokerage — are contracted from an established pool of partners integrated into the project structure.

The plant runs on photovoltaic generation with battery storage, geothermal cooling, rainwater recovery and central extraction, with an ERP system over the production flow. The proposed investment addresses the platform’s binding constraints directly: automated material flow, a second finishing line and real-time production management multiply the number of programmes the plant can run in parallel, and four premium-finish technologies bring subcontracted, higher-value specification positions in-house.

Annual interest
17.90 %
Term
10 months
Net profit
Voucher
+0 USDC
Total return0.00012345678901234567890.012345678901234567890012345678901234567890 USDC
Sign up to Invest